
Hyperspectral (HS) imaging is a non-invasive imaging technology that can reveal phenomena invisible to human vision capability. The spectral analysis aims to analyse the substances based on how their properties absorb or reflect light. Many substances or materials can be identified by their unique spectral signature, which is determined by how the substances reflect differently different wavebands of light. HS data is typically highly dimensional, which provides high accuracy and robustness for characterisation and identification tasks (Camps-Valls and Bruzzone 2005; Bioucas-Dias et al. 2013).
.

We can see from Figure 1 the monochromatic, RGB, spectroscopy, multispectral and HS image features. Monochromatic images have one channel with spatial x and y dimensions. RGB images are constructed from three colour channels (spectral dimension λ) and spatial x and y dimensions.
Spectroscopy measures dozens to hundreds of spectral channels, but the spatial dimensions are limited to one pixel. Multispectral and HS images have spatial and spectral dimensions (x, y and λ). The multispectral image typically has three to ten frames, and the spectral channel is wider than with HS images. HS images provide an almost continuous spectrum, which is constructed from hundreds or even thousands of narrow spectral channels.
Found something useful? Wish to cite? This post is based on my dissertation. For citations and more information, click here to see the scientific version of it.
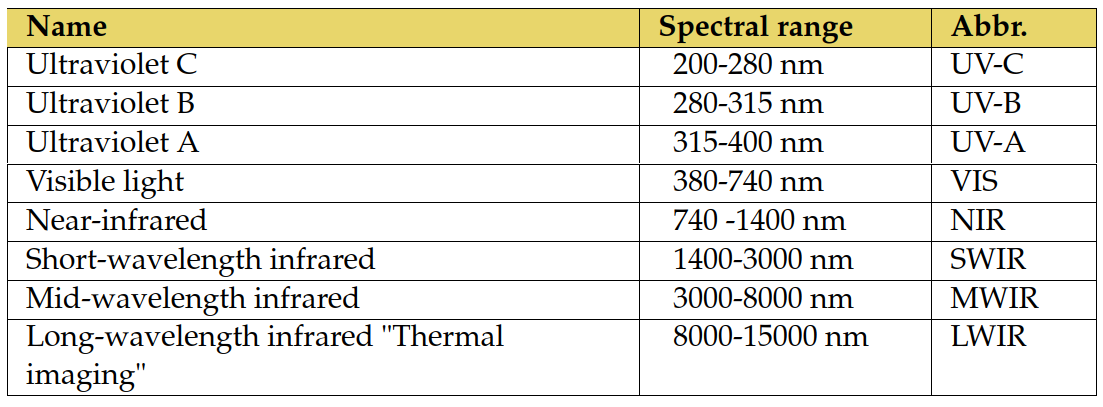
HS imaging extends traditional photography by measuring electromagnetic radiation typically from visible (VIS) and near-infrared (NIR) light (below, Tables 1 and 2). In contrast, with RGB images’ red, green and blue frames, an HS image can be considered a data cube of tens, hundreds or thousands of frames (spectral bands or channels), each representing the intensity of a different wavelength of light, as seen above.

The visible range for the human eye is approximately 380 nm to 740 nm.
The power of spectral imaging lies in the detailed pixel-wise information. Since substances emit electromagnetic radiation, the intensity distribution at different wavelengths forms the radiation spectrum. The spectrum is continuous if no clear boundaries exist between the wavelength ranges. For example, the spectrum of the light from the sun or an incandescent lamp is continuous, while the light from a fluorescent lamp is a discontinuous line spectrum. Because each substance has its characteristic line spectrum, it is identifiable.
By looking at the spectrum in Figure 2 (below), higher peaks can be observed, and their position on the wavelength axis and intensity can be compared with the known spectra. For example, the real plant in Figure 2 can be distinguished from artificial plants
based on its spectrum.
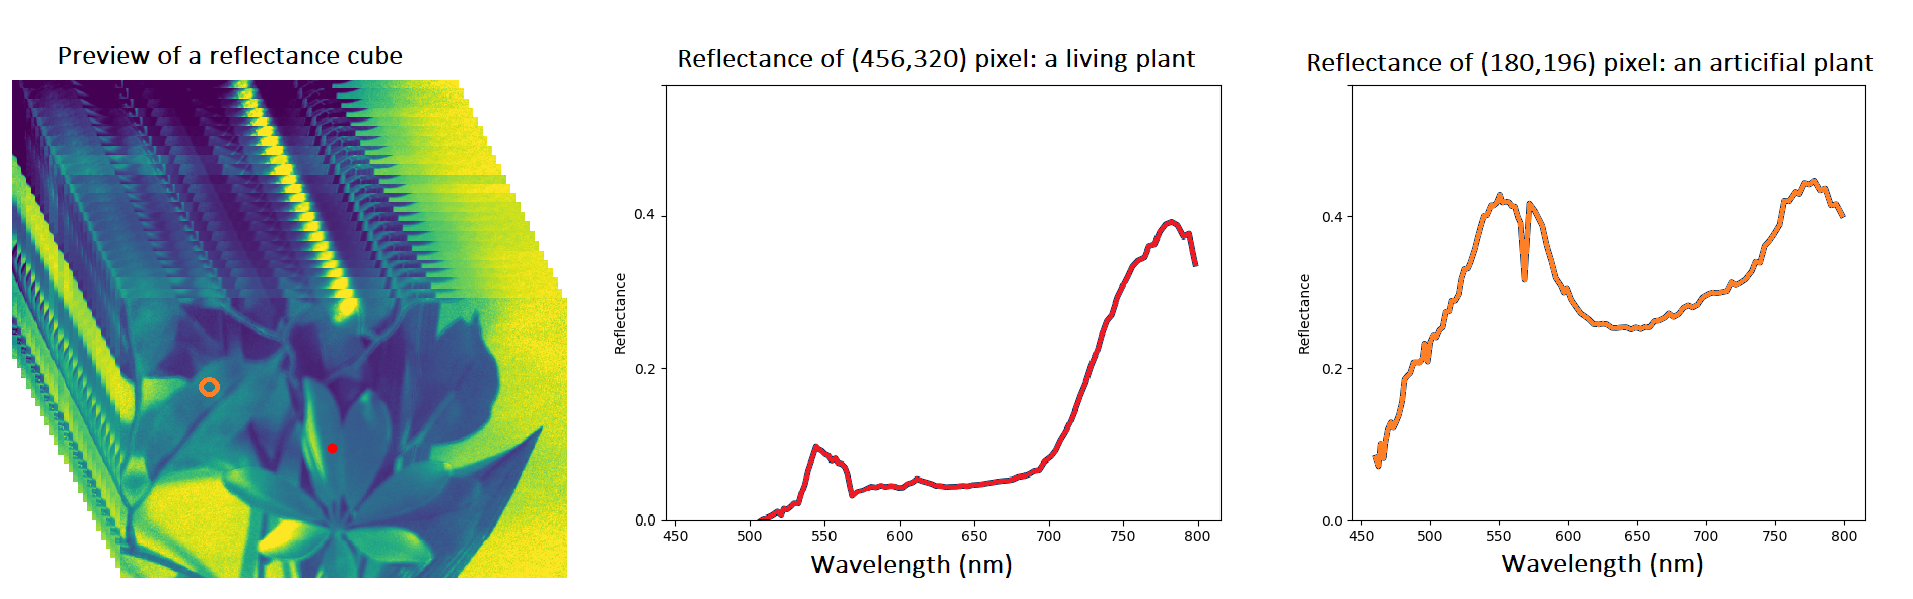
and spectrum: an artificial plant. Left: the preview of an HS image, middle: reference
spectra of a living plant, right: an example spectrum of an artificial plant.
Figure 2 is a preview of an HS image. The red spot in the figure represents a selected spatial pixel, and the spectrum is visualised on the right. Each pixel has its own spectrum, so the HS image contains spatial and spectral domains, which enable, for example, accurate pixel-wise classification (Ahmad et al. 2022). The common definitions and spectral sub-divisions and range can be seen in Table 2.
Application areas
The history of HS imaging consists of earth observation and remote sensing applications. Since developments in sensor technology led to a reduction in imagers’ physical sizes and made them more affordable (especially in VIS and VNIR range), this non-invasive method gained interest and yielded promising results in many other application fields. Some examples current applications are related to the domains of agriculture (Thorp et al. 2017), forestry (Adão et al. 2017), medicine (Fei 2020), mining (Krupnik and Khan 2019), biology (Salmi et al. 2022), food industry (Pathmanaban et al. 2019), space (Lind et al. 2021) and
defence (Makki et al. 2017)
.
Interested? Want to hear more, study this area at the University of Jyväskylä? Interested on academic or business research collaboration?
See our laboratory and contact our research group!
References
Adão, T., Hruška, J., Pádua, L., Bessa, J., Peres, E., Morais, R. & Sousa, J. J. 2017. Hyperspectral imaging: A review on uav-based sensors, data processing and applications for agriculture and forestry. Remote sensing 9 (11), 1110. https: //doi.org/10.3390/rs9111110.
Ahmad, M., Shabbir, S., Roy, S. K., Hong, D., Wu, X., Yao, J., Khan, A. M., Mazzara, M., Distefano, S. & Chanussot, J. 2022. Hyperspectral image classification—traditional to deep models: A survey for future prospects. IEEE Journal of Selected Topics in Applied Earth Observations and Remote Sensing 15, 968 https://doi.org/10.48550/arXiv.2101.06116.
Bioucas-Dias, J. M., Plaza, A., Camps-Valls, G., Scheunders, P., Nasrabadi, N. M. & Chanussot, J. 2013. Hyperspectral remote sensing data analysis and future challenges. IEEE Geoscience and Remote Sensing Magazine 1 (2), 6–36. https://doi.org/10.1109/MGRS.2013.2244672.
Camps-Valls, G. & Bruzzone, L. 2005. Kernel-based methods for hyperspectral image classification. IEEE Transactions on Geoscience and Remote Sensing 43 (6), 1351-1362. doi:10.1109/TGRS.2005.846154.
Fei, B. 2020. Hyperspectral imaging in medical applications. In Data Handling
in Science and Technology, Vol. 32. Elsevier, 523–565. https://doi.org/10.1016/B978-0-444-63977-6.00021-3.
Krupnik, D. & Khan, S. 2019. Close-range, ground-based hyperspectral imaging for mining applications at various scales: Review and case studies. Earth-science reviews 198, 102952. https://doi.org/10.1016/j.earscirev.2019.102952.
Lind, L., Laamanen, H. & Pölönen, I. 2021. Hyperspectral imaging of asteroids using an fpi-based sensor. In Sensors, Systems, and Next-Generation Satellites XXV, Vol. 11858. SPIE, 65–78. https://doi.org/10.1117/12.2599514.
Makki, I., Younes, R., Francis, C., Bianchi, T. & Zucchetti, M. 2017. A survey of landmine detection using hyperspectral imaging. ISPRS Journal of Photogrammetry and Remote Sensing 124, 40–53. https://doi.org/10.1016/j.isprsjprs. 2016.12.009.
Salmi, P., Calderini, M., Pääkkönen, S., Taipale, S. & Pölönen, I. 2022. Assessment of microalgae species, biomass, and distribution from spectral images using a convolution neural network. Journal of Applied Phycology 34, 1–11. https: //doi.org/10.1007/s10811-022-02735-w.
Thorp, K. R., Wang, G., Bronson, K. F., Badaruddin, M. & Mon, J. 2017. Hyperspectral data mining to identify relevant canopy spectral features for estimating durum wheat growth, nitrogen status, and grain yield. Computers and Electronics in Agriculture 136, 1–12. doi:10.1016/j.compag.2017.02.024.